How can aerial surveying help to monitor climate change?
Understanding and adapting to a transforming world
In the ever-evolving landscape of climate change, geospatial science emerges as a key player in navigating the complexities of our transforming world. The European Association of Aerial Surveying Industries (EAASI) propels aerial surveying into the spotlight, shedding light on its fundamental role in climate change monitoring.
Over the last two decades, there have been significant advancements in aerial survey technology, revolutionizing crewed aerial surveying operations. These advancements have enhanced the accuracy, efficiency and versatility of aerial surveys, expanding their applications across various sectors.
In parallel, an alarming acceleration of climate change has been observed. According to the World Meteorological Organization (WMO), 2023 was the warmest year on record. Remarkably high land and sea-surface temperatures have been prevalent since June, coupled with an unprecedented decrease in Antarctic Sea ice levels. Disturbingly, the areas impacted by drought have surged by 29% since the turn of the millennium. The frequency of extreme weather events is soaring, painting a gloomy picture. Unless greenhouse gas emissions are curbed, these impacts will intensify, bringing even graver consequences.
How can aerial surveying help? Aerial surveying plays a crucial role in climate change monitoring. Modern aerial platforms can gather diverse data, enabling tracking of changes in land cover, vegetation health and other climate variables over large spatial scales. Aeroplanes and helicopters provide access to difficult or dangerous-to-reach areas, essential for monitoring remote areas like glaciers, ice sheets and coastal regions. The frequency of data collection is high, allowing consistent tracking of climate variables over time, and aiding in a more comprehensive understanding of changes in the climate.
Climate change monitoring and crewed aerial surveying intertwine
In fact, the integration of aerial surveying into climate science dates back to 1947 when a US Navy aircraft embarked on the inaugural aerial survey of the Arctic ice sheet. Since then, scientific and government organizations have frequently used aerial surveying to capture data about changes in the environment. One of the most illustrative examples is the IceBridge Operation conducted by NASA to meticulously measure parameters like height, depth, thickness, flow and changes in sea ice, glaciers and ice sheets. From 2009 to 2019, IceBridge – the most extensive polar airborne survey of its kind – was meticulously crafted to dissect annual thickness alterations in ice formations. Moreover, it aimed to bridge the crucial data gap between the ICESat and ICESat-2 polar observing satellites. Over this timespan, ICE Bridge accomplished an astounding 1,056 scientific missions, amassing a wealth of data that has not only redefined but also revolutionized the comprehension of the cryosphere.
Through accurate mapping obtained by remote sensing, airborne data and other geospatial data sources, stakeholders gain insights into climate patterns and vulnerabilities, enabling strategic interventions. Various concrete examples are available from member companies of EAASI, as highlighted in this article.
Aerial surveying for forest and vegetation monitoring
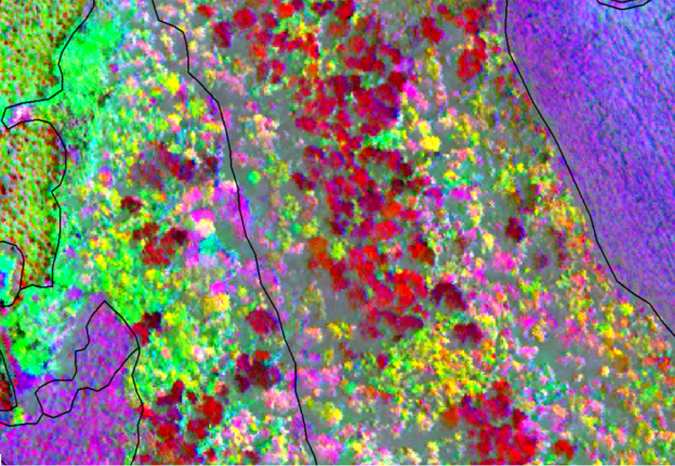
In recent years, Lidar and hyperspectral imaging have been progressively integrated into aerial survey aircraft. Lidar sensors emit laser pulses to measure the distance to objects on the ground, creating dense point clouds that can be used to generate highly accurate 3D models. Hyperspectral imaging sensors capture images across a wide range of wavelengths, beyond the visible spectrum, which can be used to identify different types of materials and objects.
Crewed aerial surveying equipped with these kinds of sensors has emerged as a game-changer in monitoring changes in vegetation. Lidar, for instance, enables precise 3D mapping of forests, aiding in quantifying vegetation density and assessing the impact of deforestation. Multispectral imaging allows for comprehensive analysis of vegetation health, detecting stress and degradation. This invaluable data guides conservation efforts and informs policies to mitigate deforestation and enhance carbon sequestration (see Cases 1 and 2).
Case 1: The preservation of forest heritage in Chile (GEOFIT and HELIGRÀFICS)
Whether native or planted, forests represent invaluable reservoirs of biodiversity that demand protection. Native forests house a wealth of indigenous species, including the Chilean Araucaria, which is a national emblem and a living fossil due to its ancient origins.
The company Arauco seeks precise information for resource utilization while preserving the fauna and flora. In collaboration with HELIGRÀPHICS CHILE, GEOFIT conducts airborne Lidar surveys and aerial photography missions. The collected data is used to create inventories, including volumetric calculations and georeferencing of operational forests. Each year, between 350,000 and 600,000 hectares are meticulously mapped, highlighting the dedication to sustainable forest management and conservation of Chile’s unique biodiversity.
Traditional methods of vegetation assessment require extensive hours of fieldwork and human resources. Airborne Lidar technology streamlines this process, with aircraft scanning and photographing hundreds of hectares of forest per hour, emitting laser pulses that capture both vegetation and terrain. After data processing, a detailed three-dimensional representation is generated, enabling precise estimation of timber volumes based on tree locations, vegetation density and terrain characteristics.
Subsequently, the team create an orthomosaic by merging aerial images with Lidar surveys (the sensor used is a RIEGL Vux-240), providing highly accurate geographic and visual representations of the forests. This information contributes to more efficient forest management, reducing clear-cut areas.
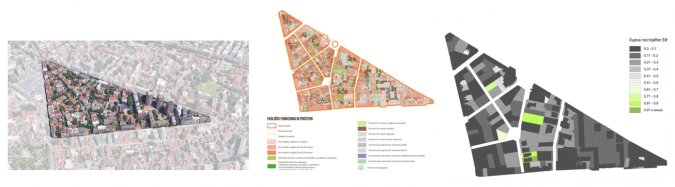
Case 2: Green infrastructure in a compact city – ecological indexing as an instrument of resistance to climate change (Teledyne Geospatial and Mapsoft)
Mapsoft recently completed a high-profile project for the Association of Landscape Architects in Serbia. The goal was to quantify the greenery in Belgrade in response to the loss of porous surfaces over the past years. Through that quantification and geospatial scenario modelling (e.g. the impact of planting more trees of a certain height in a certain location), it would be possible to derive urban planning bylaws for future development (e.g. maintaining a minimum number of trees in certain areas). Through these measures, decision-makers ultimately aim to improve urban quality of life and diminish air pollution.
To provide answers, Mapsoft used the Teledyne Geospatial Optech Galaxy on a fixed-wing aircraft to map the entire city. This resulted in a map of urban land cover, 3D models and footprints of buildings, rooftops classified by slope, and tree locations and crowns. The analysis leveraged the richness of the data to derive the Ecological Index, describing the health of a city plot.
Surveying the cryosphere
Climate change is having a significant impact on the cryosphere: the frozen part of the Earth’s system which includes ice sheets, glaciers, sea ice, snow cover, permafrost, and frozen lakes and rivers. The cryosphere plays an important role in the Earth’s climate system by reflecting sunlight back into space, regulating sea levels and storing freshwater.
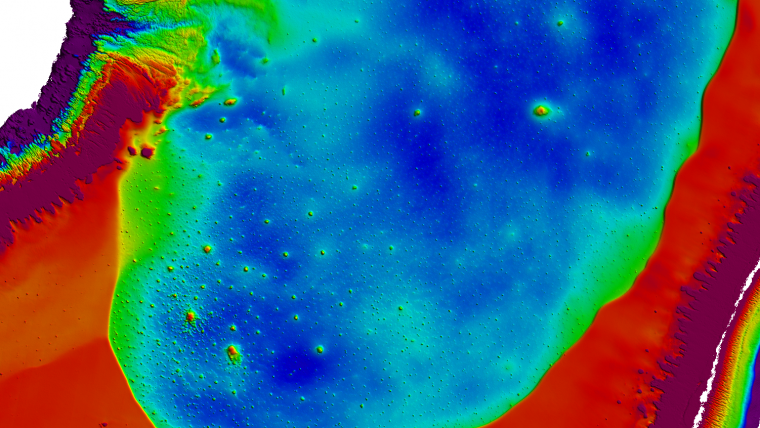
In the field of monitoring changes in the cryosphere, crewed aerial surveying employing remote sensing technologies like synthetic aperture radar (SAR) and thermal infrared imaging is pivotal (see Case 3). SAR can penetrate cloud cover and darkness, providing detailed data on ice movement and structure. Thermal infrared imaging aids in analysing the surface temperatures of glaciers, ice caps and polar regions. These insights are crucial in understanding ice melt patterns and predicting sea-level rise to facilitate informed adaptation and mitigation strategies.
Case 3: Combined thermal/RGB-image flight in Pasterzenkees/Großglockner (AVT Airborne Sensing)
AVT Airborne’s combined thermal/RGB-image flight project over Austria’s Pasterzenkees/Großglockner exemplifies the utility of aerial imagery in monitoring mountain glaciers. The project responded to the urgency of understanding and addressing glacier decline in the face of climate change. The high speed of deglaciation is pushing conventional methods of glacier observation to their limits. The thermography of glaciers is a good tool to determine the thickness of debris layers on the glacier surface. In addition, thermographic images can be used to validate energy balance models, classify glacier surfaces and determine glacial surface meltwater runoff.
Satellites and uncrewed aerial vehicles (UAVs) are often used for this purpose. However, there are certain restrictions. Satellites enable large-scale coverage of glaciated areas, but only provide products with a coarse spatial resolution. Meanwhile, UAVs provide high-resolution data but are severely limited in spatial coverage. This test project was intended to demonstrate the feasibility of airborne thermal flights. It may be possible to close the gap between satellite and UAV data by using airborne thermography in glaciology. In addition, possible further applications should be identified in the context of monitoring the cryosphere.
AVT flew this area with two different resolutions. The resolution of the thermal flight was 60cm and 120cm. The resolution of the RGB images was much better (10cm and 25cm). It should be noted that the thermal data does not represent the surface temperatures but rather the recorded long wavelength infrared (LWIR) or thermal infrared range (TIR) radiation of the surface, the intensity of which is ‘translated’ by the sensor into a temperature value (°C or Kelvin).
This project supports the addressing of climate challenges by contributing to glacier research and the understanding of cryosphere changes. AVT’s project demonstrates the significance of aerial surveys in monitoring mountain glaciers in the context of climate change.
A critical tool in disaster risk management, response and recovery efforts
Aerial surveying plays a crucial role in disaster risk management, response and recovery (see Case 4). Hyperspectral imaging can identify subtle environmental changes, aiding in risk management, post-disaster damage assessment and recovery planning. Photogrammetry facilitates the creation of high-resolution 3D models, assisting in disaster impact analysis and recovery strategy formulation. Rapid and accurate post-disaster data acquisition is instrumental in effective response and resilience-building.
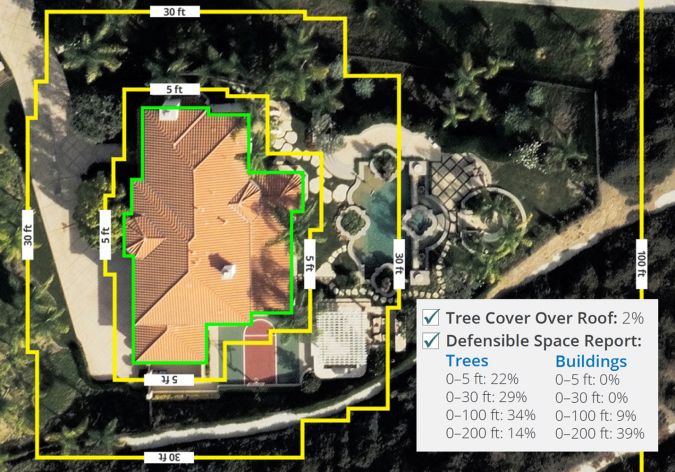
Case 4: Risk assessment for properties in wildfire-prone areas (Vexcel Imaging)
As the world’s climate changes, geospatial technology can help map, analyse and visualize information to better understand and mitigate key global challenges such as wildfire risk. Vexcel Imaging collects high-resolution aerial imagery in more than 30 countries using its UltraCam sensors, pairs it with artificial intelligence (AI) analytics, and uncovers key property information in wildfire-prone areas such as California, USA. Multiple pieces of data are delivered, including valuable defensible space information that determines how safe and protected a property is from fire danger. In California, defensible space is broken up into four buffer zones that lead out from a property in 5, 30, 100 and 200-foot (1.5, 9, 30.5 and 61-metre) increments.
Using this analysis, homeowners and insurers can work together to create a detailed property risk assessment of where overgrowth of trees or proximity of buildings in each zone could lead to wildfire damage or danger to a property or home.
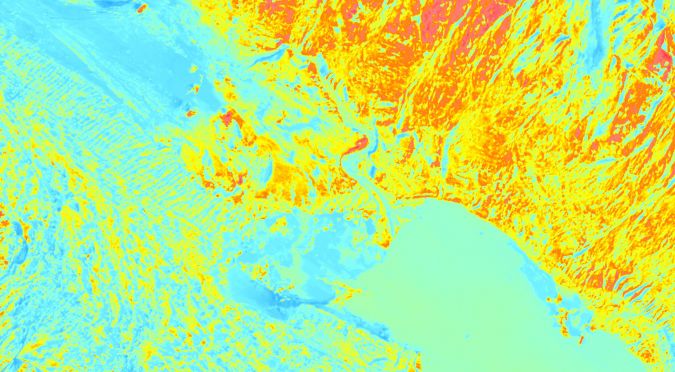
Coastal and river monitoring
For monitoring changes in coasts and rivers, crewed aerial surveying employs bathymetric Lidar and photogrammetry (see Case 5). Bathymetric Lidar provides precise underwater topography mapping, essential for studying coastal erosion and its impact on habitats. Photogrammetry aids in monitoring riverbank erosion and sediment transport. These insights contribute to sustainable coastal and riverine management to address climate change-induced challenges.
Case 5: Bathymetric projects (Woolpert)
Woolpert was contracted to acquire topo-bathy Lidar data of Saint Lucia’s entire landmass and coastal zone. The contract was signed under the World Bank’s Disaster Vulnerability Reduction Project (DVRP), which aims to measurably reduce vulnerability to natural hazards and climate change in Saint Lucia and the Eastern Caribbean Region.
In 2022, Woolpert was contracted by The Pacific Community to collect topo-bathy Lidar data and aerial imagery for the Kingdom of Tonga. The data was collected to support nautical charting for navigation safety, infrastructure planning and rehabilitation, and disaster resilience and recovery. This project is part of The Pacific Community’s Pacific Resilience Program, also funded by the World Bank. It is working to strengthen early warning systems and enhance natural disaster and climate change resilience across Pacific Island countries prone to natural disaster events such as cyclones, storm surges, coastal inundation, earthquakes and tsunamis.
Woolpert has supported several US organisms, including the Joint Airborne Lidar Bathymetry Technical Center of Expertise (JALBTCX), National Geodetic Survey, National Oceanic and Atmospheric Administration (NOAA NGS), Office for Coastal Management, National Oceanic and Atmospheric Administration (NOAA OCM) and United States Geological Survey (USGS), with topo-bathy Lidar data acquisition in the Pacific Region and the USA for coastal resilience, modelling and post-storm response. Most recently in Alaska, such data supported JALBTCX and NOAA NGS in their post-storm response aerial surveys after Typhoon Merbok.

In the USA, Woolpert collects high-density Lidar of the coastline for multiple counties in Florida at the beginning of each hurricane season. In the event of a hurricane or strong storm, Lidar is captured again and a comparative analysis conducted. To assist authorities to better plan and mitigate erosion along the coastline, elevation changes are then modelled between the two datasets and a volumetric analysis created of where the sand loss and gain occurred. This aerial-derived data enables coastal communities to assess vulnerability and plan their next steps to resilience.
Conclusion
As climate change continues to reshape the world, the union of crewed aerial surveying and geospatial science stands as an indispensable force. The evolution of aerial surveying is underpinned by remarkable advancements that have revolutionized the geospatial industry. The integration of cutting-edge sensor technologies like Lidar, hyperspectral and thermal imaging has empowered surveyors to create high-resolution 3D models and accurately identify materials. Extended endurance and range have expanded the capacity to cover vast areas without interruption, while sophisticated data acquisition systems efficiently manage large data volumes. The incorporation of advanced stability and vibration control mechanisms ensures the consistency and accuracy of survey results. These technological leaps collectively contribute to a comprehensive and precise geospatial dataset, ultimately empowering society to combat climate change more effectively.
However, it is not only about data collection nowadays. As mentioned in a previous article by GIM International, the geospatial and surveying industry is experiencing a profound evolution, transitioning from its traditional focus on data collection to a newfound emphasis on data analysis. While data collection remains integral, the power of analysing geospatial information is now more critical than ever in deciphering the intricate impacts of climate change. Surveyors have transformed into specialized data analysts and are an essential addition to the fight against climate change.
Scenario simulations, particularly digital twins, have the potential to revolutionize climate-resilience decision-making. These models can simulate diverse climate-related scenarios, offering insights into vulnerabilities and necessary adaptations. Digital twins enable proactive planning and management, safeguarding both people and planet from the escalating impacts of climate change.
While airborne data collection remains a cornerstone, the true power lies in the ability to seamlessly combine and harness data from diverse sources. This synergy is a game-changer, enabling society to unravel the multifaceted impacts of climate change and land degradation with unparalleled precision. By fusing insights from aerial surveys, satellite imagery, ground-based data and advanced sensor technologies, we gain a comprehensive understanding of our changing world. It is through this multi-layered approach that we can equip ourselves to address the challenges posed by climate change, armed with the knowledge needed to make informed decisions, adapt to shifting circumstances and work towards a more sustainable future.
Further reading
The role of surveyors in building climate resilience, GIM International [issue 7, 2023]
Value staying current with geomatics?
Stay on the map with our expertly curated newsletters.
We provide educational insights, industry updates, and inspiring stories to help you learn, grow, and reach your full potential in your field. Don't miss out - subscribe today and ensure you're always informed, educated, and inspired.
Choose your newsletter(s)


